Context Observability
What context is, why it matters and how to gain observability over it — Improving the effectiveness of LLM assisted workflows.


It is evening, a developer is at the computer, deep in a programming session, he is using an LLM agent. As the night goes on, the developer uncovers one bug hiding behind another, the developer gains understanding, the agent accumulates context. Over time the session begins to chug, and responses become more diffuse, frustration builds, eventually the developer logs off. The next day he checks his agent session quota and sees that he has burnt the lion’s share of it.
Maybe some of you will recognise this scenario, it is a frustration that I have experienced personally in recent weeks and context is at the heart of it. In this article I will share what context is, why it matters and how you can mitigate this frustration by instrumenting your development environment to unlock effective context management.
Context is the working set the model uses to generate its next response. In a coding session, that includes more than the visible prompt: prior conversation, files, diffs, terminal output, errors, tool results, plans, and assumptions carried forward from earlier work. The user sees the latest instruction, but the model operates over the accumulated session state.
Context size affects the cost, latency and quality of responses:
- Cost. A request is charged according to the input tokens the model must process and the output tokens it generates. In a long-running coding session, the visible instruction may be small, but it is evaluated against a much larger accumulated context. More context means more tokens spent.
- Latency. A larger working set means more input tokens to process and more prior state for the model to consider when generating its response. The larger the context, the longer responses take.
- Quality. This is the hardest to observe, because unless you are experienced, the higher quality response is intangible. Context which is diffuse and irrelevant does not support the current request, it bogs down the model and can degrade the quality of a response.
Given context can have such a strong impact on the user experience, gaining observability over it becomes increasingly valuable. Something which can affect outcomes so directly should not be hidden state.
However, since the larger context, the more tokens get used, and the more tokens that get used, the more the vendor gets paid, vendors are not directly incentivised to make context visibility a first-class concern.
Claude Code is a powerful LLM coding assistant which I have been utilising heavily in recent weeks. It has been especially effective operating less as a disembodied agent, instead as a model with access to project context, data, tools and as a part of the development operating system itself.
This is the default Claude status line that it ships with, it does not display any context information at a glance.
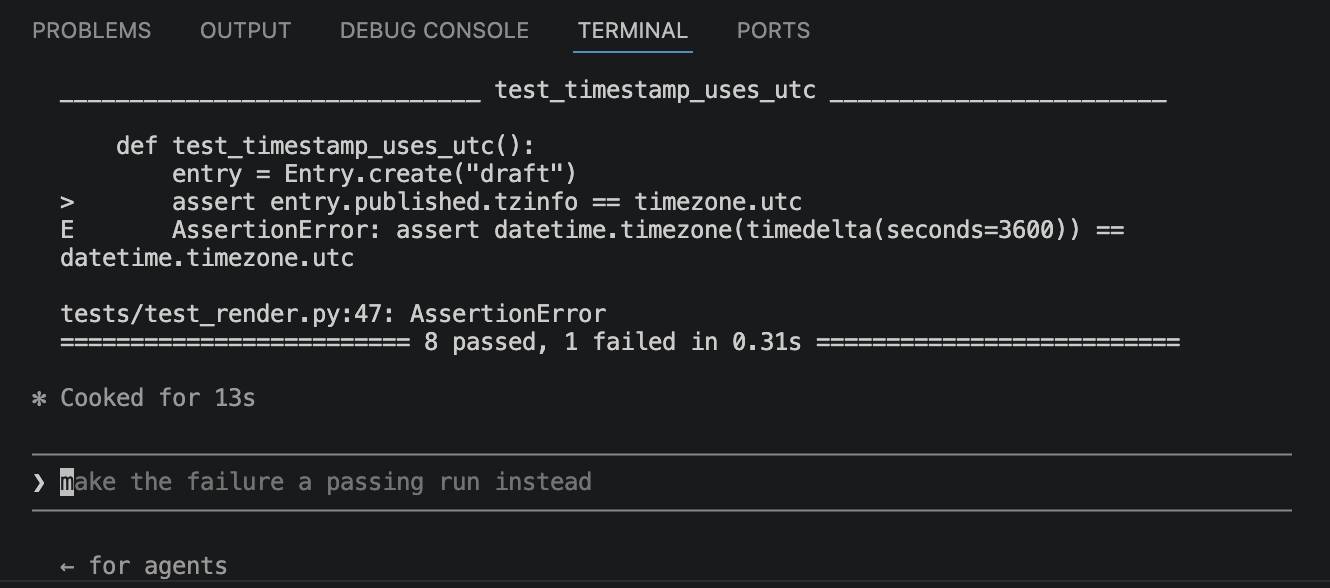
The only two non-user initiated context hints that I have seen in Claude are auto-compaction and session usage warnings. Auto-compaction of context triggers when context approaches its cap (which for the models I’m using in Claude at time of writing is one million tokens). However, by the time such a threshold is approached performance is usually already degraded. The usage warnings that Claude provides are only indirectly related to context. They trigger as you approach your subscription session limit cap - however, this is mostly an opportunity to up-sell you, directing you to the ‘/upgrade’ command.
It is possible to inspect context via the /context command. However, this requires an explicit user initiated action, which amounts to remembering to perform session management mid-flow. This is fine for in-depth inspection but is too interrupt-dependent to rely upon. The problem here is a lack of context observability.
You can gain context observability in Claude by leveraging a custom status line script.

This is my status line, it has five sections from left to right:
- Model currently in use
- Git branch
- Context token count
- Percentage of 5 hour session used and when that session resets
- Percentage of weekly session used and when that session resets
Sections 1 and 2 provide general development observability, useful to have at a glance to orient yourself.
Section 3, the token count segment is the most valuable piece of information, this tells you the current context size. I have tuned it to turn red when exceeding 150k context tokens, and to graduate through green -> yellow -> orange before that. 150k is a threshold that Claude itself describes (via /usage) as expensive to cross.
Sections 4 and 5 relate to subscription session usage. In Claude Code you have the option of subscription or API key pricing, subscription pricing being much more cost effective at time of writing. These also change colour graduating through green -> yellow -> orange -> red as you approach 100% usage.
And here it is, the status line in action, under load:
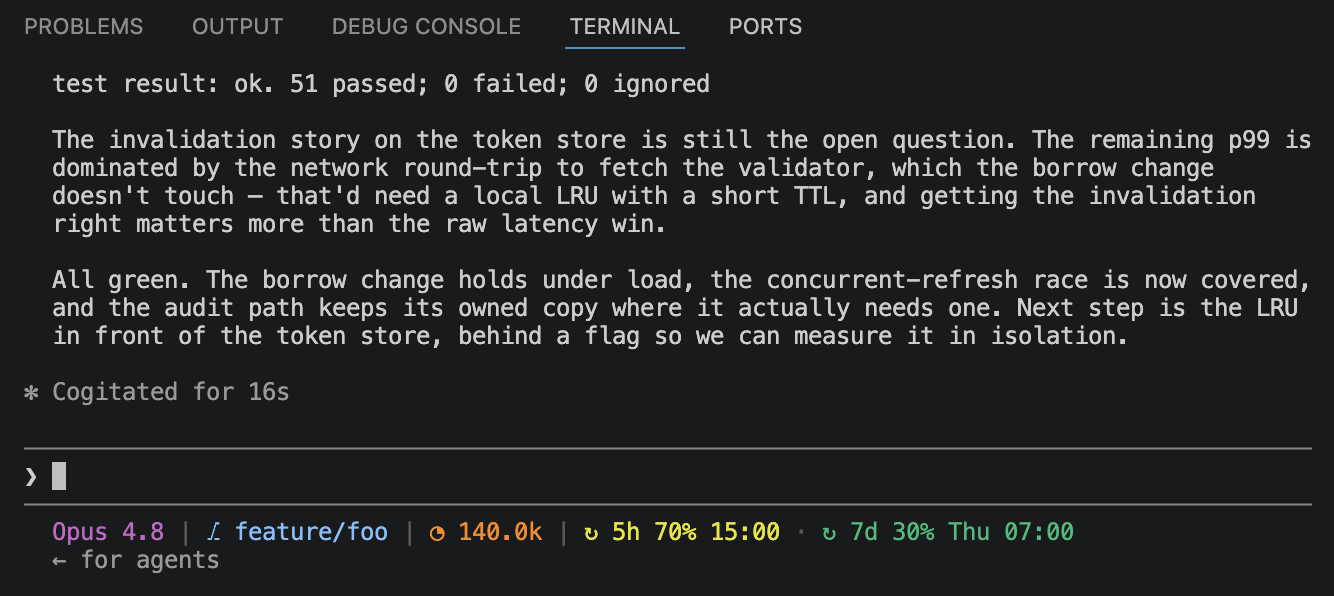
You can clearly see at a glance that we are using Opus 4.8, on a feature branch, context is high at 140k tokens, that we are approaching that 5 hour session limit and that we have used 30% of weekly allowance, information that is hidden by default. With this status line we are aware of the rising context, the usage constraints, and know we should look for a good place to cull the context soon.
Context is an increasingly important resource in development workflows. Rather than relying upon development discipline, context observability provides the necessary awareness for effective context management at a glance.
Follow the instructions in the gist here to install it.